We have been working on our “Fixometer” project for a couple of months now, assembling a team with The Engine Room and Circular Ecology to create an online tool that will show the positive environmental impacts of our community repair.
One of our first tasks, creating a data model to estimate the environmental impact of our repairs, was a little intimidating! There are so many ways of doing this, and the more precise they are, the more complex they are.
We decided to focus on two measures to start:
– CO2 emissions prevented (a calculation based on pre-use CO2 footprint)
– weight diverted from waste
Our priority was to simplify, as it would be impossible for us to measure the environmental impact of each repair. Even weighing devices on the spot would interrupt the flow of our events.
In the past two years, we’ve come up with 34 categories for the +800 broken gadgets we’ve seen at our community events. These categories fit in four categories: computers and home office, electronic gadgets, home entertainment, kitchen and household items.
Together with a team of six volunteers and the coaching of Craig Jones (Circular Ecology), we have spent over 60 person-hours scouring the internet for data on the pre-use carbon footprint of these 34 device categories. We looked in academic journals, in company CSR reports, on company websites, on Google Scholar, on industry databases, in documents prepared for the EU.
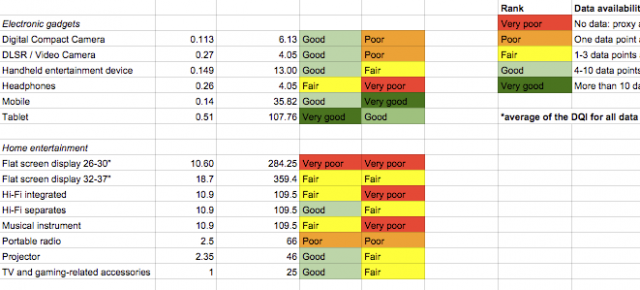
The idea was to collect as much as possible then rate every data point for quality (a taster below). And it is important to note that there is no standard for carbon footprinting, meaning that making comparisons between the footprints of different products, or categories of products, could be deceptive.
What we found – and didn’t
Certain device categories, like mobiles, computers and tablets produced enough data. It seems that manufacturers (with some glaring exceptions) are increasingly sharing the results of their intricate life cycle analysis (LCA), which measure resources spent at production, distribution, use and disposal phases.
(We are most interested in production and distribution, because we are trying to estimate how many of these emissions have been prevented by extending the lifecycle of a device.)
Perhaps not from every manufacturer, but we found adequate reference data, after much trawling of the web. There were some manufacturers of handheld electronics and computers that disappointed.
Certification? Lovely. Now give us the raw data please. #CO2 #electronics #mobiles pic.twitter.com/KWN8xWr4Sd
— The Restart Project (@RestartProject) December 13, 2014
Example of useless data format of electronics CO2 emissions. Manufacturers, please give us tables with numbers! pic.twitter.com/bSoAyDl0Oz
— The Restart Project (@RestartProject) December 13, 2014
Some categories of devices: particularly audio equipment, accessories, and certain household appliances proved extremely difficult. Some of these we were forced to estimate using proxy assumptions or interpolations.
All in all, we were able to find data for 29 of 34 categories.
It is worth noting most of the data we found in the home entertainment and kitchen and household appliance clusters came from third party reports, not from manufacturers. We found audio equipment and musical instruments manufacturers particularly bad about sharing data.
We contacted a couple of manufacturers directly to ask if they allowed consumers to access this data, and we were gobsmacked by the responses. Customer service representatives had no real notion what CO2 footprint data was, or why we might want it. Others told us that consumers would not understand that there is no standard for this data, and would make “unfair” comparisons to competitors.
But companies were not the only ones blocking access to this data. Academic research – often funded by public bodies – is kept behind publisher paywalls. We found one reference to a carbon footprint of a toaster presented by some young engineers at an academic conference, but it was subsequently placed behind a paywall that even engineer friends had no access to.
When we launch the Fixometer, we will share this full data set (including sources) with the public, including a complete “gap map” indicating where data quality and availability is poor, invite people to contribute. Our dream is to inspire students conducting lifecycle assessments to choose gadgets where data is lacking, and to up the ante for manufacturers who we know have data they simply do not share.
In the meantime, here are some of our take aways from our collaborative (and exhausting) campaign to learn more about the environmental impact of e-stuff:
Best practices
- Reporting on every device by date of release (like Nokia and Apple)
- Offering raw data in table form – respect us enough to give us numbers
- Having data independently reviewed
- Providing a breakdown of CO2 emissions data by lifecycle phase
- Listing assumptions
- Dating documents properly and revealing their origin (if by third parties)
Worst practices
- Burying data on websites (companies) or behind publisher paywalls (academics)
- Referring only to energy consumption or other so-called “green” credentials, providing no information about manufacture and embodied carbon
- Publishing only diagrams with unclear numbers
- Referring to existing data, and boasting about it, but not releasing any number
We would like to thank WRAP for funding this work through the Innovation in Waste Prevention Fund.

Brilliant.